| Help |
|
| Brief introduction |
|
For a given disease with omics data, we developed a drug community-regulated networks (PharmaCoNets) approach that simulates drug treatment effects for drug screening and elucidating mechanisms (drug-target-pathway-symptom relationships). The PharmaCoNets approach integrates Homopharma1, hierarchical systems biology networks (HiSBiN)2, and community-regulated pathways (CoNet) to predict drug community regulated networks. We first identified the disease targets based on differentially expressed genes (DEGs) in the input omics datasets evaluated by disease gene scores (SDisG) by integration Homopharma and HiSBiN. Aiming for multi-target drugs, for each FDA drug the identified drug-target pairs form a drug community with a score SDC. In the next step of CoNet, the regulation of Kyoto Encyclopedia of Genes and Genomes (KEGG) pathways3 (with score SDP) by each drug community was predicted, thus obtaining the drug community-regulated networks, scored by SDN . Finally for the disease of COVID-19, multi-target FDA drugs were prioritized based on the PharmaCoNet scores (SPCN), which combined SDC and SDN scores, followed by clustering based on the regulated pathways. For instance, here we identified methotrexate as a multi-target COVID-19 drug candidate based on its community regulated networks (pathways of neutrophil extracellular trap formation). Moreover, PharmaCoNets also reveals the drug mechanisms i.e., the drug–target–pathway–symptom relationships underlying the drug effects.
|
Methods details: |
|
I. PharmaCoNets: Multi-targeting drug scoring and application on COVID-19 |
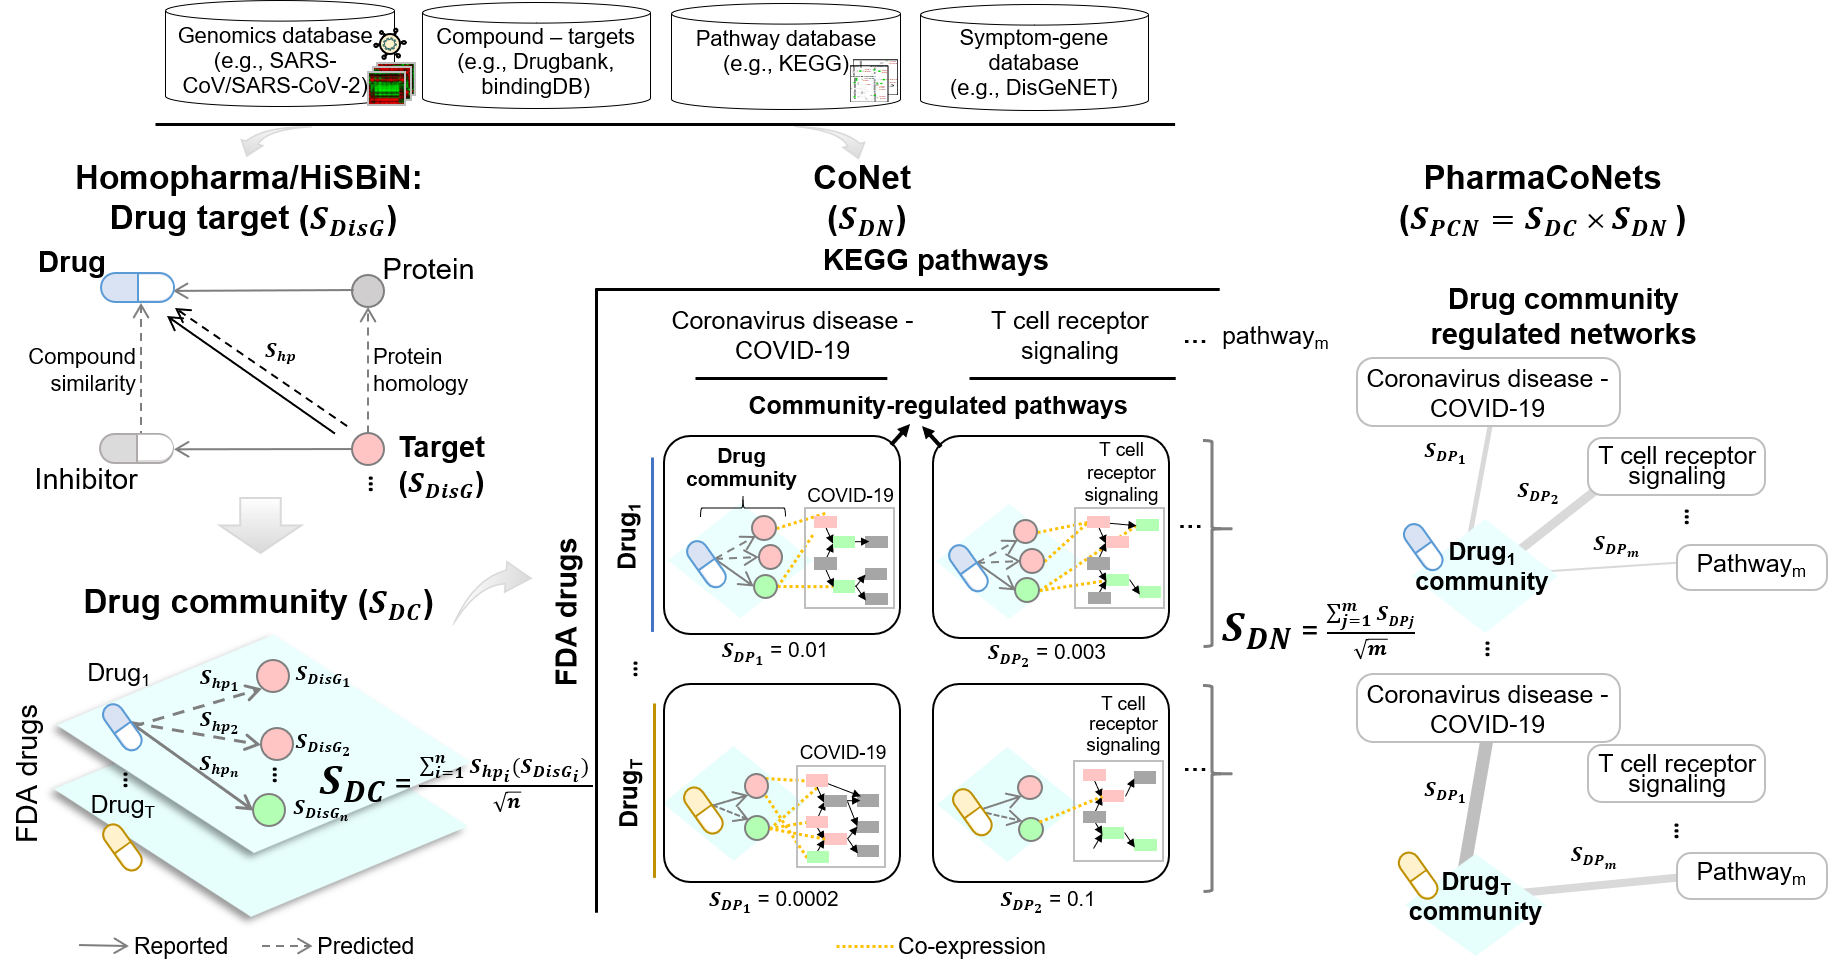
To predict multi-target drug candidates for COVID-19, we developed a drug scoring method SPCN that was calculated as follows:
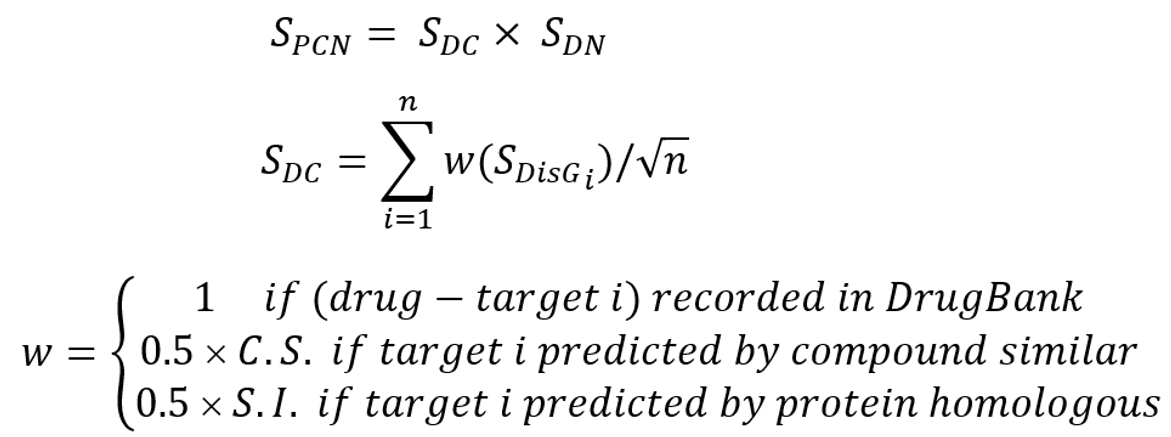
where n is the target number of a drug community; SDisGi is the therapeutic target score of target protein i and defined in Equation (1); SDN is CoNet score of a drug community and defined in Equation (3). Finally, we computed the SPCN values of 2,303 FDA-approved drugs.
|
|
II. A systematically integrated approach for identifying disease genes |
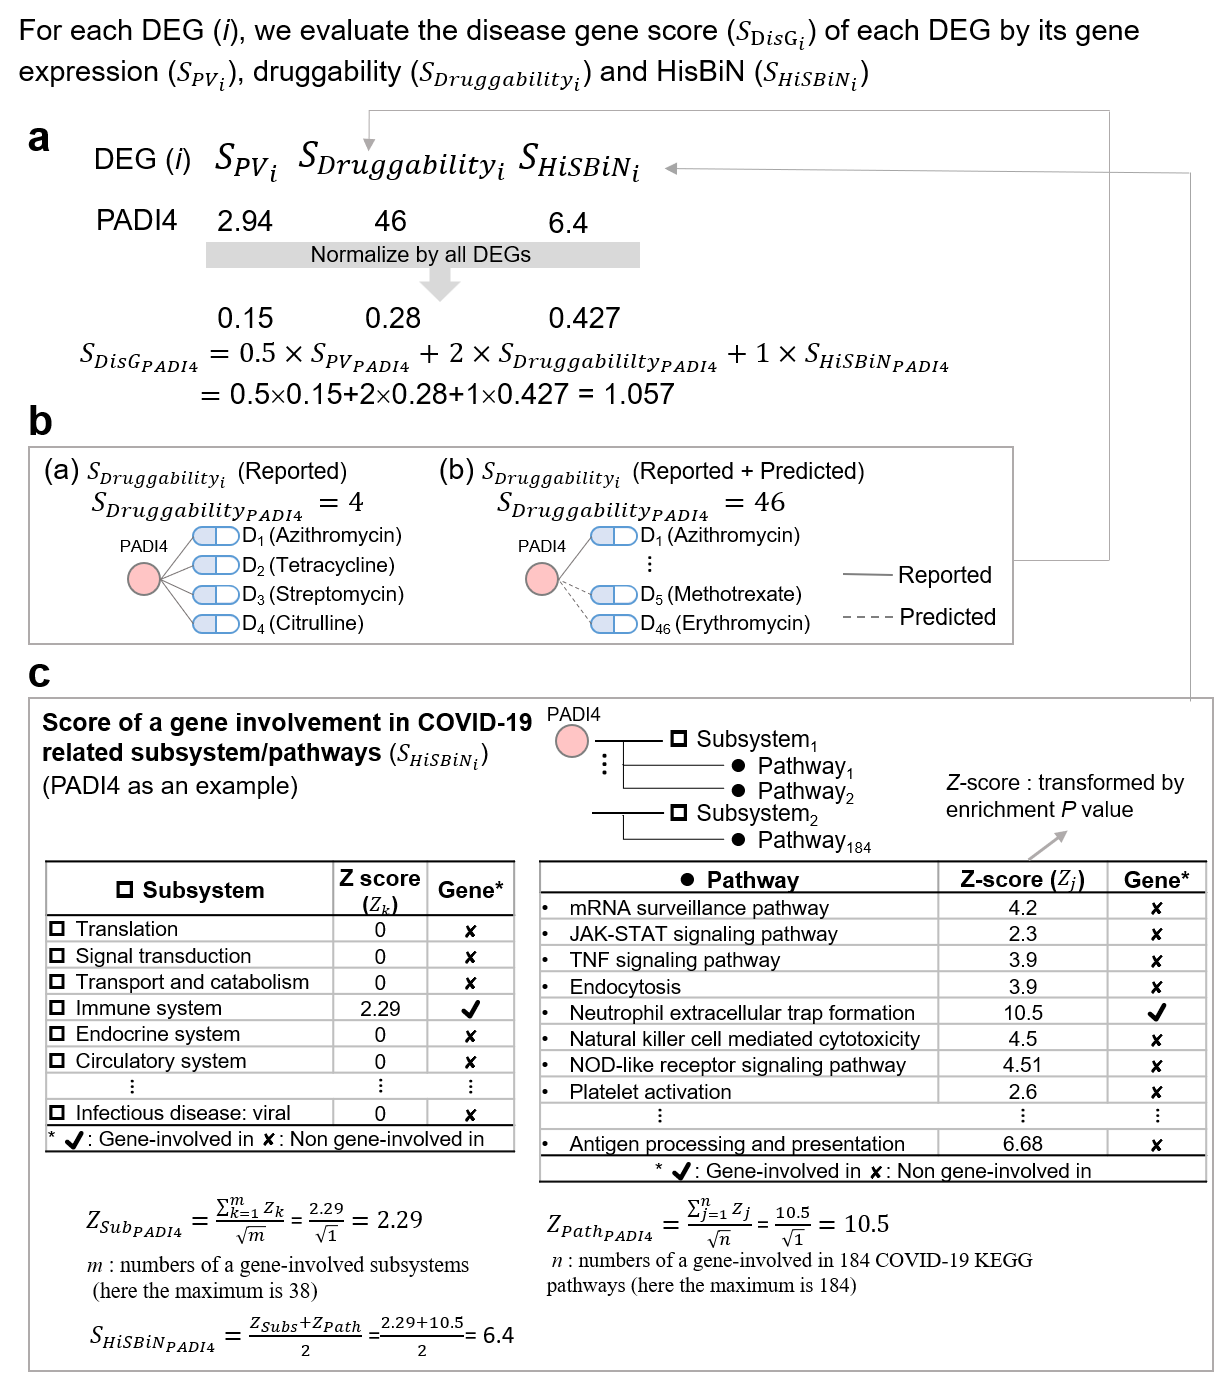
To infer disease genes, we developed a scoring function to calculate the disease gene score (SDisG) of DEGs. The SDisGi score of a DEG (i) consists of the gene expression significance p value (SPVi) between disease and corresponding normal samples, its druggability (SDruggabilityi) measuring the number of interacting drugs, and its involvement significance (SHiSBiNi) in pathways and subsystems using HiSBiN (Figure a). SDisGi is defined as follows:

where i is the DEG (i), and wPV is the weight of SPV, wD is the weight of SDruggability, and wp is the weight of SHiSBiN. Here, the weights were set to 0.5, 2, and 1 to wPV, wD, and wp respectively. We statistically analyzed and normalized these three scores ranging from 0 to 1 across all the DEGs and 0 ≤ SDisG ≤ 3.5. The detailed scoring method and scheme for identifying therapeutic target score for the gene i are as follows, and the example of PADI4 is shown in Figure.
In the first stage, we consider the gene importance for a disease by using SPVi, which is the maximum p value of target i of gene expression in two SARS-CoV GEO datasets (GSE5972: precrisis, crisis and GSE1739) and was computed as follows:
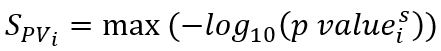
The p value was calculated by the GEO2R analysis tool, s was number of datasets.
In the second stage, SDruggabilityi is used to determine the draggability of a DEG i, which is considered as the number of targeting drugs derived from the Homopharma. For example, for the gene PADI4, which is one of the DEG of methotrexate community, has reported as being the target of four drugs (e.g., Azithromycin, Tetracycline, Streptomycin, and Citrulline) in the recorded drug-target pair database (i.e., Drugbank) and 42 predicted approved drugs derived from Homopharma (Figure b).
In the third stage, to evaluate how DEGs and drug targets are involved in pathways during SARS-CoV-2 infection, we first collected 342 human pathways containing 7,806 proteins (genes) from the Kyoto Encyclopedia of Genes and Genomes (KEGG) database3. We then modified the hierarchical systems biology model (HiSBiM)2 from our previous work to measure the involvement of drug targets in the KEGG pathways, including DEG identification, pathway enrichment, and subsystem contribution by ‘hierarchical systems biology network (HiSBiN)’. The DEGs for COVID-19 were identified based on fold change and p value between normal and SARS-CoV (or SARS-CoV-2) infection samples. To yield KEGG pathway enrichment of the DEGs, the p value of hypergeometric distribution was calculated as follows:
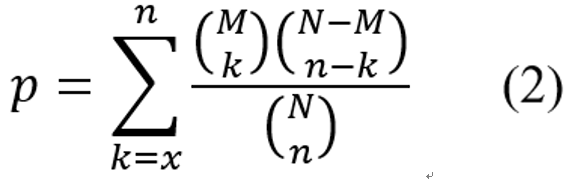
where N is the number of all genes in the KEGG database, M is the number of DEGs, n is the number of genes and k is the number of DEGs in a specific KEGG pathway.
To understand how each DEG is involved in KEGG subsystems and pathways, we defined the SHiSBiNi of a DEG i as follows:
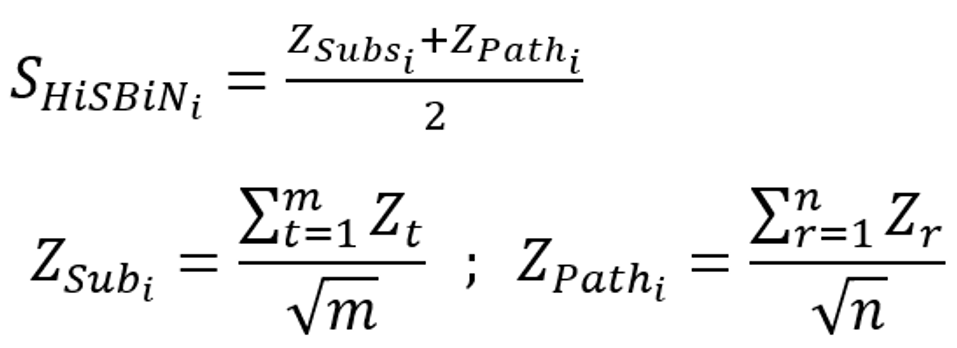
where and ZPathi are the meta-z-scores of the subsystems and pathways in which a DEG i is involved; Zt and Zr are the z-scores of subsystem t and pathway r, respectively; and m and n are numbers of a DEG-involved subsystems and pathways of 184 COVID-19 KEGG pathways, respectively. The z-score of each pathway was the p value transformation using a standard normal distribution. The detailed example of gene PADI4 was shown in Figure c.
|
|
III. Community–regulated diseases-related network by co-expression network (CoNet) |
For construction of the PharmaCoNets of each drug with its target proteins (drug community) in disease (e.g. coronavirus infectious disease), we evaluated the enrichment of co-expressed gene pairs between all genes of drug communities and disease-related pathways using the gene expression profiles of infected by SARS-CoV/SARS-CoV-2 human blood/ nasopharyngeal tissue samples. Based on our previous work, we have systematically study cancer membrane protein-regulated networks (CaMPNet) by the construction of membrane protein community and its regulated cancer-related pathways through this methodology 4. We then modified from our previous work to measure the involvement of drug communities regulation of diseases-related in the KEGG pathways, including drug community identification, and pathway enrichment contribution by ‘co-expression network (CoNet)’.
For each coronavirus disease type, two DEG’s with Pearson’s correlation coefficient |Pearson’s r| ≥ h (here, h is set to 0.7 based on a large effect size) were considered a co-expressed pair. For each DEG as an involved gene in the drug community, we first used the co-expressed pairs between it and a disease-related pathway to determine its involvement (enrichment p value is converted to z-score) for this pathway in each cancer type based on hypergeometric distribution. Moreover, for each drug community, we measured the involvement between its involved genes and all the DEGs of regulated pathways in disease. To yield KEGG pathway enrichment of the drug communities, the p value of hypergeometric distribution was calculated as Equation (2), where i and n are the numbers of co-expressed gene pairs and all the combinational gene pairs, respectively; x is the observed co-expressed gene pairs with |Pearson’s| ≥ 0.7; M and N are the total numbers of all the co-expressed gene pairs and combinational gene pairs, respectively, between all the involved DEGs of the drug community and all the DEGs in 342 KEGG pathways.
To understand how each drug community is involved in KEGG pathways, we defined the CoNet score (SDN) of a drug community as follows:
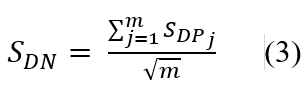
where SDPj is the drug community-regulated pathway score (z-score converted by enrichment p value) of the pathway j in which drug community are involved; and m is numbers of disease DEGs enriched pathways (i.e., here is the 184 COVID-19 KEGG pathways identified by SARS-COV DEGs). The z-score of each pathway was the p value transformation using a standard normal distribution.
|
|
Reference |
-
Chiu, Y. Y. et al. Homopharma: a new concept for exploring the molecular binding mechanisms and drug repurposing. BMC Genomics 15 Suppl 9, S8, doi:10.1186/1471-2164-15-S9-S8 (2014).
-
Yang, W. Y. et al. Omics-based Investigation of Diet-induced Obesity Synergized with HBx, Src, and p53 Mutation Accelerating Hepatocarcinogenesis in Zebrafish Model. Cancers (Basel) 11, doi:10.3390/cancers11121899 (2019).
-
Kanehisa, M. & Goto, S. KEGG: kyoto encyclopedia of genes and genomes. Nucleic Acids Res. 28, 27-30, doi:10.1093/nar/28.1.27 (2000).
-
Lin, C. Y. et al. Membrane protein-regulated networks across human cancers. Nat Commun 10, 3131, doi:10.1038/s41467-019-10920-8 (2019).
|
|
Copyright © 2022 BioXGEM Lab.
Institute of Bioinformatics
National Yang Ming Chiao Tung University
Hsinchu, Taiwan, R.O.C.
All rights reserved.